Came across this on Big Hairy News yesterday.
The source data for the chart is extracted from the following should anyone want to "do their own research"
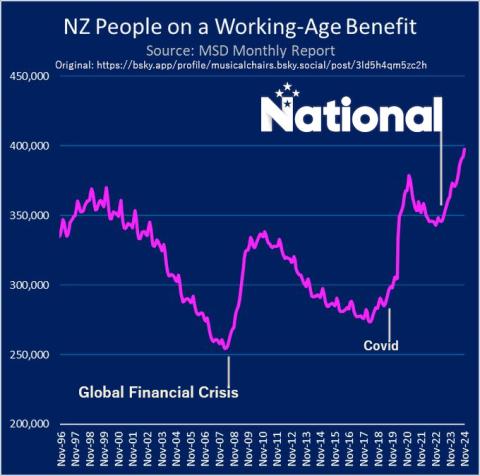
I was curious to know what caused these spikes. In 2 cases, it was a global event. No one should be "blamed" for that.
One of them though is the intended consequence of decisions made.

Here's the same graph with the events marked out.
To quote the post from Musical Chairs:
We have added 50,000 people to working-age benefits in the last 18 months. It has typically taken us five fking years (and a housing market boom) to get back from that.
Musical Chairs - December 13, 2024 at 12:43 PM